CEAT Ltd - annual net profit increased by 348.9%
A tyre company which is market leader in 2-wheeler segment
Company name - CEAT Ltd
Last closing price(NSE:CEATLTD) - ₹3020 (as on 24-Sep-2024)
Estimated reading time - 3 minutes
<summary of previous analyses available here>
Executive Summary
CEAT, established in 1958, is one of the largest tyre manufacturers in India. CEAT became a part of the RPG Group in 1982.
It is the market leader in 2-wheeler segment with 33% market share(as of FY 2024) and 3rd largest in Passenger Car and Utility Vehicles(PC/UV) segment with 16% market share.
Net profit increased by 348.9% and EPS increased by 345% annually on account of increase in operating profit margins.
Stock price chart
Detailed analysis
About the company
CEAT, established in 1958, is one of the largest tyre manufacturers in India. CEAT became a part of the RPG Group in 1982.
It is the market leader in 2-wheeler segment with 33% market share(as of FY 2024) and 3rd largest in Passenger Car and Utility Vehicles(PC/UV) segment with 16% market share.
Future prospects
What is the company’s plan to maintain earnings growth in future?
Price hikes planned in 2-3 wheelers and PC/UV segments.
Continue double-digit growth in the export markets in passenger, truck-bus radial, and agri radials.
R&D - focus on product development for truck-bus radial, passenger, and 2-3 wheelers.
Potential risks which can hamper the future growth
The company is facing headwinds from significant freight hikes and non-availability of containers in international business. Freight rates have increased by 300% for movements to Europe.
Natural rubber prices currently at INR224 per kg, the highest in 12 years.
Headwinds from reduced demand in the auto sector.
Financial analysis
Overview
The company has a strong ROCE of 20.4%, and promoter holding is at 47.2%.
The debt-to-equity is at 0.44 and the pledged percentage is 0%.
Quarterly results
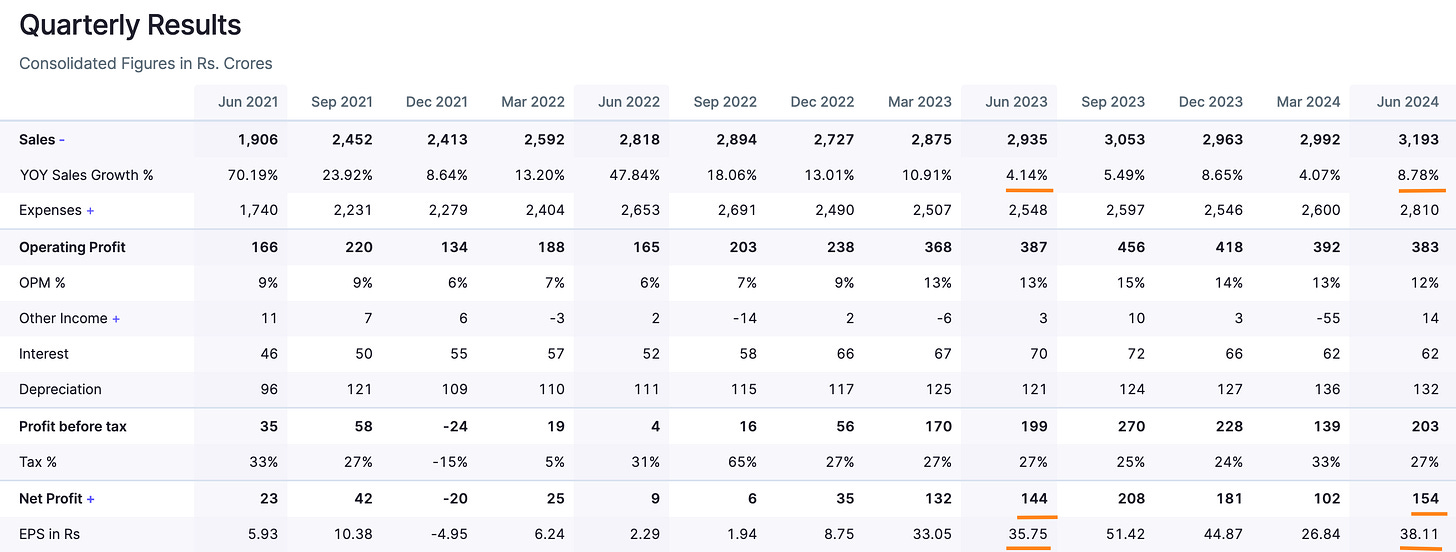
Growth in key metrics in the latest quarter Q1 - 2025 compared to the last year’s same quarter -
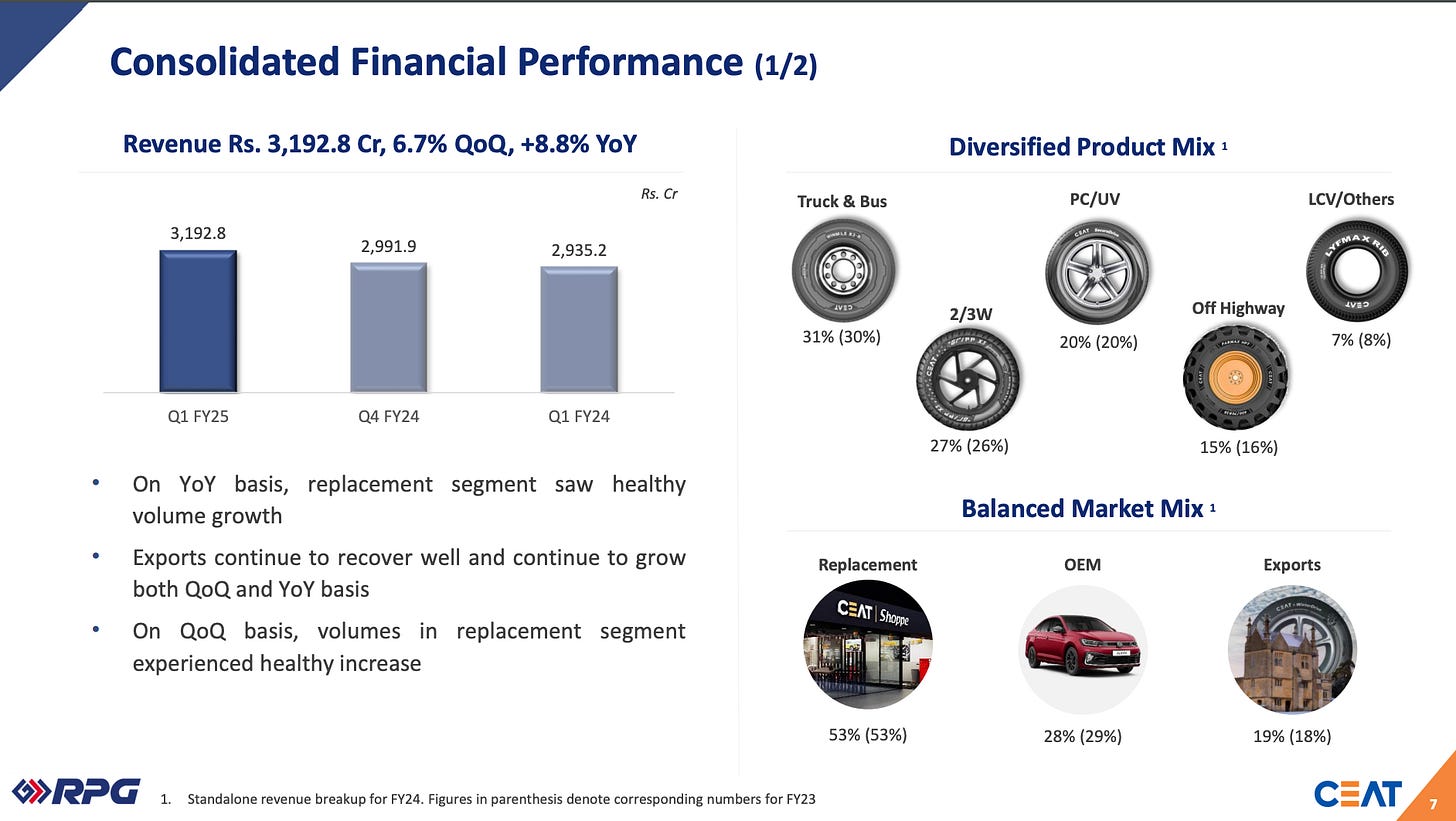
The sales grew by 8.78%, highest growth in the last 5 quarters.
The operating margins reduced by 1pp on account of increased marketing spends in this quarter.
The net profit increased by 6.9% and EPS increased by 6.6%
Annual results
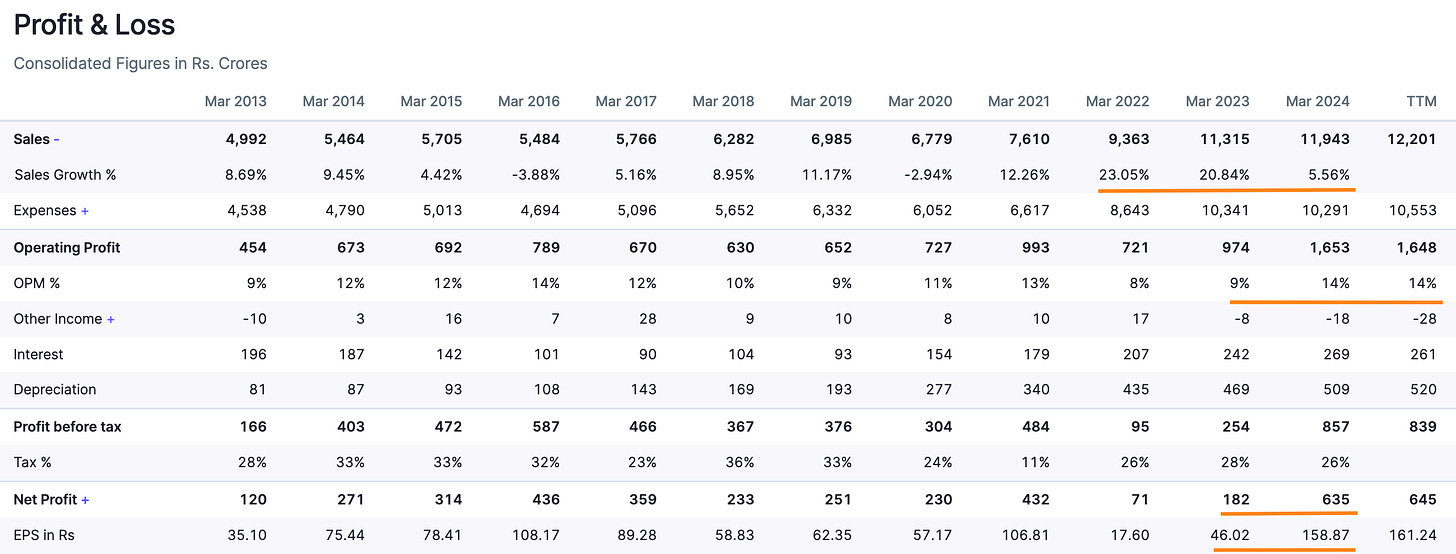
Growth in key metrics in the last financial year 2024 compared to the previous financial year -
The company has been reporting double digit sales growth since FY 2021, but the growth reduced to 5.56% in FY 2024 on account of increased in raw material costs and port congestions affecting volumes.
But the company managed to increase the operating margins by 55%, which led to significant growth in profits. In the current FY also the company is maintaining similar profit margins.
Net profit increased by 348.9% and EPS increased by 345% annually.
Peer comparison
The company has the highest ROCE of 20.42% among peers in similar sales range.
The P/E of peers above CEAT Ltd is in the range of 19 to 37, whereas for CETA it is currently trending at 17.7. There is potential the P/E to grow if the company is able to maintain it’s growth.
Timing analysis
Institutional high trading volume signs seen recently in the week of 24-June(10x), 15-Jul(9x) and 02-Sep(4.8x).
Did you find our analysis on CEAT Ltd valuable? Help us reach more investors like you.
This is not a stock recommendation. It’s an analysis of the stock basis the data available today, and the viewpoint can evolve in future. Please read our Disclaimer here.
Credits : Financial data source - screener.in


