
Timing/Technical analysis of a stock
Estimated reading time - 4 mins
Hello,
In this post, we’ll discuss how we determine if the timing of our stock selection and entry is appropriate.
This falls broadly under the category of technical analysis, which is a vast and complex subject that requires significant time to master and practice. To simplify this process, we focus on a few fundamental principles that form the basis of any technical analysis.
We have found these principles to be sufficient for our analysis. The three key factors we consider are:
Trend Alignment to Dow Theory
Determine if the stock is in a primary uptrend, characterized by higher highs and higher lows. Confirm alignment with broader market movements to validate the trend.
Institutional Interest with Volume Analysis
Track buying and selling activity by institutional investors. Increased volume typically signals strong interest and confidence in the stock’s future performance.
Price Near Support Levels
Filter out stocks that are far from support levels or are near resistance levels based on historical price movements to identify optimal entry or exit points.
Case Study: Punjab National Bank (PNB)
Let’s take Punjab National Bank (PNB) as an example to illustrate this framework.
Financial Analysis
This is a brief summary of PNB’s financial performance:
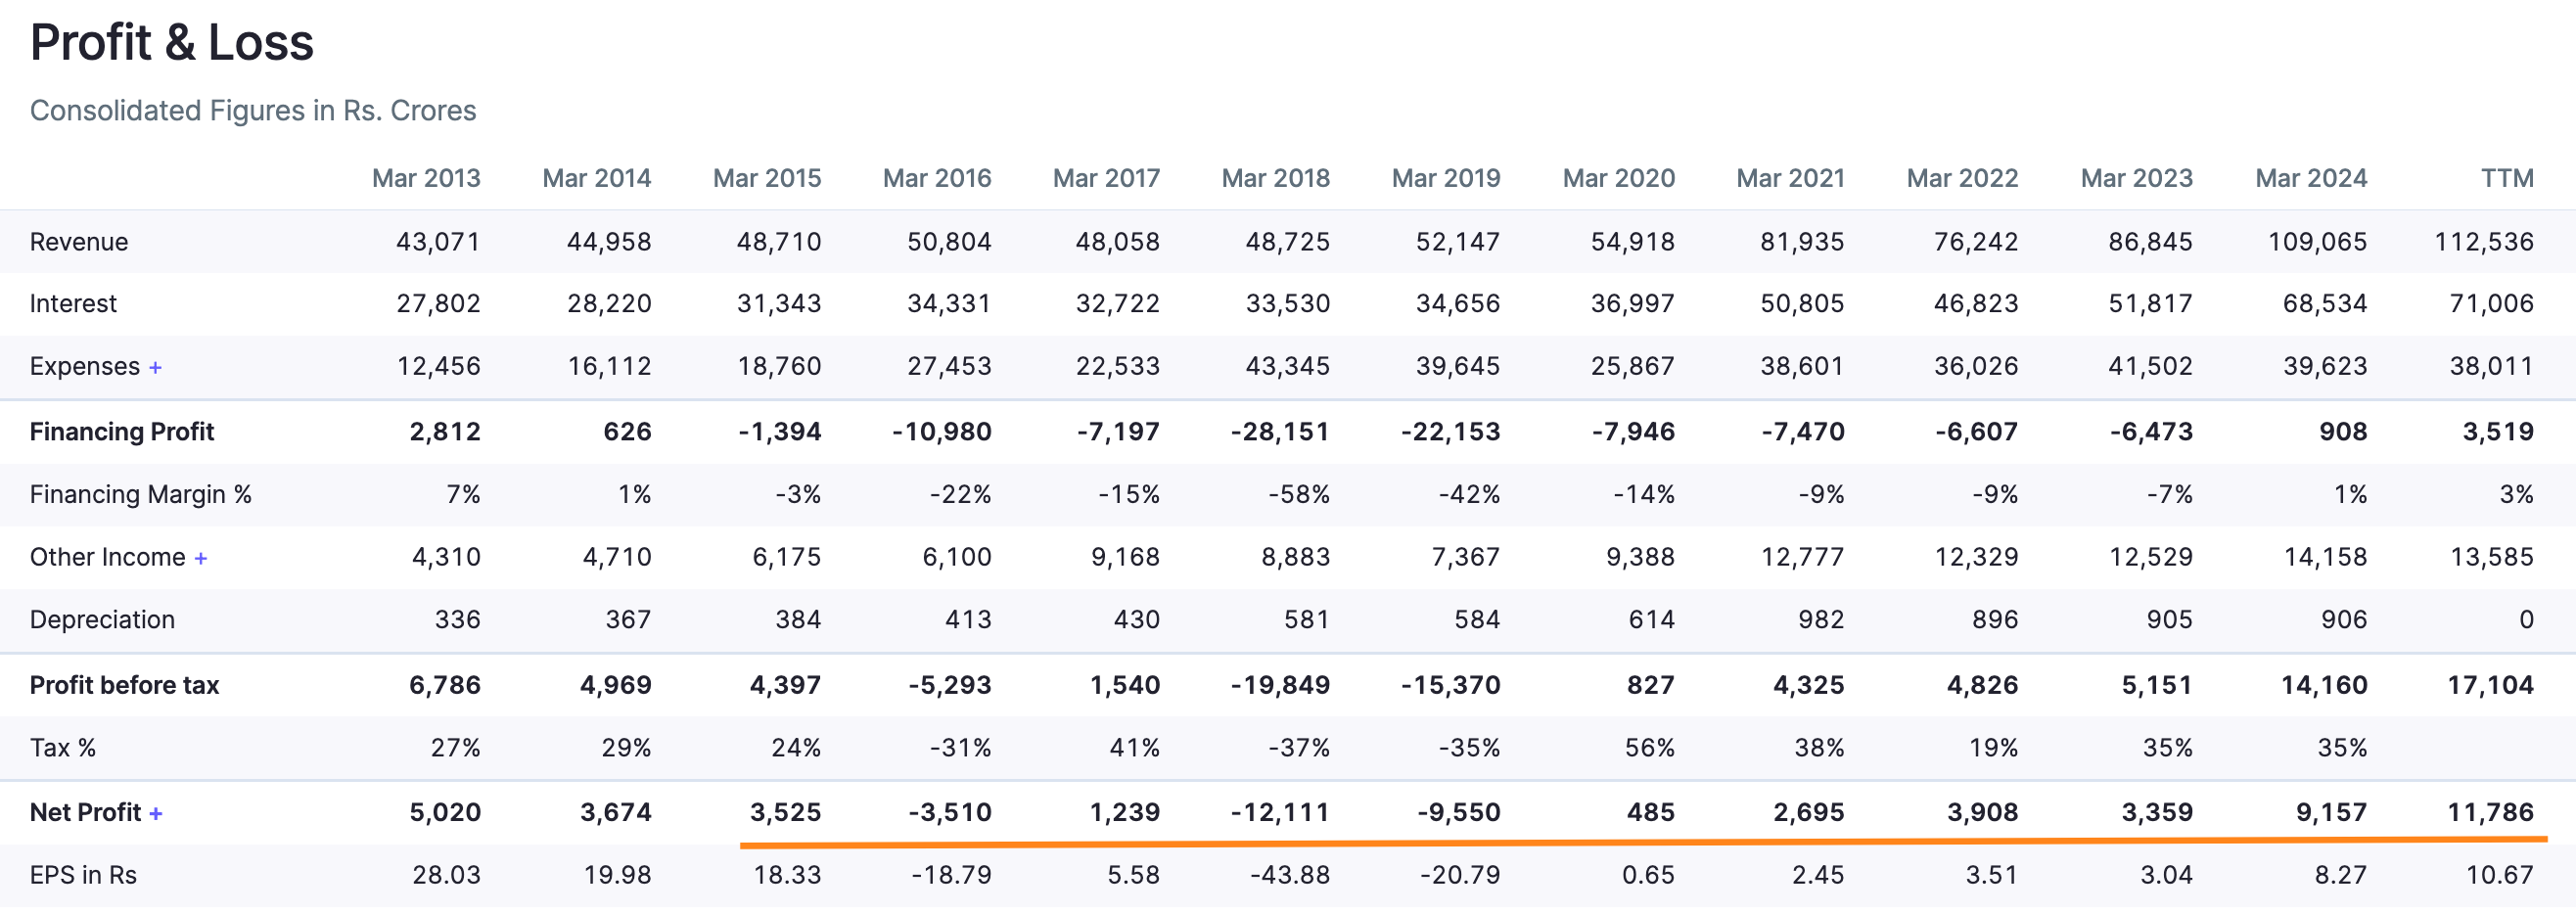
Net Profit Analysis:
• In FY 2015, the company posted a net profit of ₹3525 Cr.
• Over the next four years, PNB experienced a decline and reported negative results until FY 2019.
• In FY 2020, the company saw a turnaround with a net profit of ₹485 Cr.
• By FY 2022, PNB’s net profit returned to FY 2015 levels, reaching ₹3908 Cr.
• Currently, the net profit is at a lifetime high of ₹11,786 Cr in the last 12 months.
Technical stock price chart
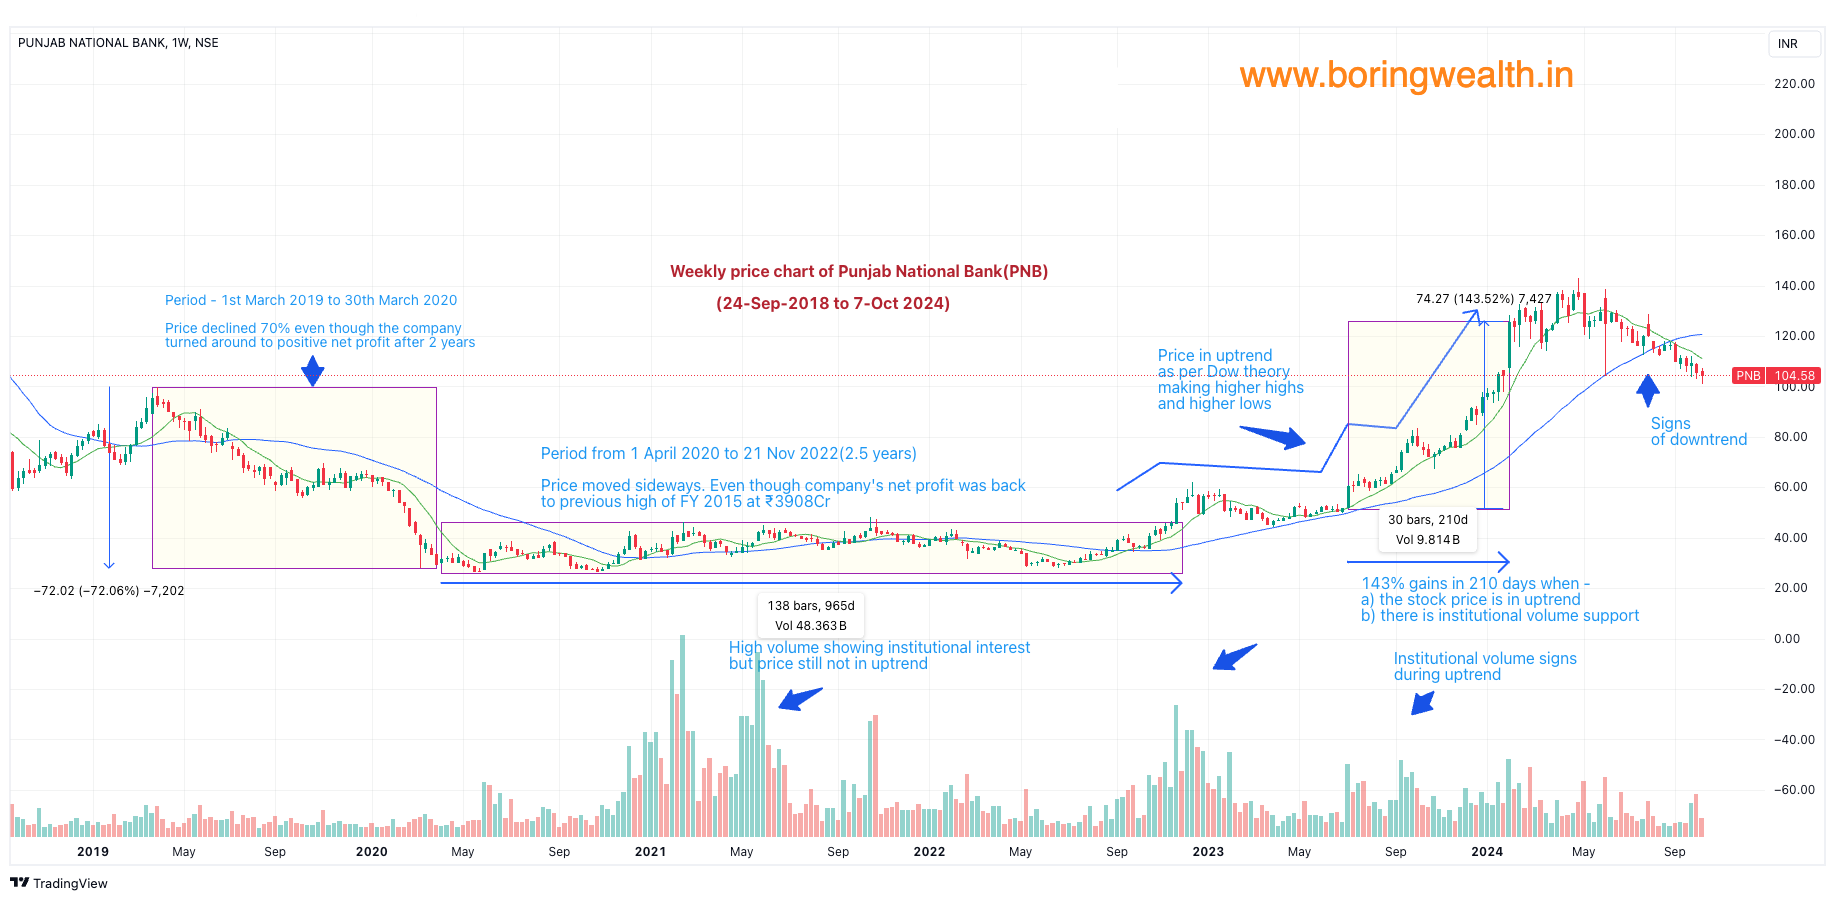
Below is a weekly price chart of Punjab National Bank, where each candlestick represents one week.
Key Observations (in relation to the financial analysis):
Downtrend and Sideways Phase
• Despite the positive turnaround in FY 2020, the stock price declined by 70% during the same period.
• From April 1, 2020, to November 21, 2022 (a period of 2.5 years), the stock moved sideways even though net profits had recovered to FY 2015 levels at ₹3908 Cr.
• There were indications of high institutional interest through volume analysis, but the price uptrend had not yet started.
Note: Investing during this phase would have led to a net decline and missed opportunity cost, despite the company’s improving financial performance.
Uptrend Phase
• During the uptrend phase, as per Dow Theory’s principles of higher highs and higher lows, the stock price gained 143% in just 210 days.
• This uptrend was supported by high-volume activity driven by institutional interest, indicated by high volumes.
Note: Investing during this phase would have yielded significantly higher returns. In the earlier phase, it would have been more advantageous to allocate capital to a stock already in an uptrend with strong institutional interest.
This case study demonstrates the importance of timing when entering a stock, even if the financial fundamentals are improving. Our approach helps avoid opportunity costs by ensuring that capital is deployed in stocks showing positive price action and institutional support. Also, explains why we don’t operate with the ‘buy and forget’ approach.